
Key Takeways
- 50-page SEO PDFs kill client trust and clarity
- Clients only care about revenue, leads, and growth trends
- Replace reports with single-page dashboards (Looker Studio style)
- Focus on conversions, non-branded traffic, and key actions
- Add simple executive summaries (video > long written reports)
- Cut vanity metrics and highlight business-impact data only
Nothing kills a retainer faster than a monthly document that your client needs a data science degree to understand. For years, agencies have dumped massive, bloated PDFs into their clients' inboxes, filled with meaningless metric charts, endless technical jargon, and zero business context. If your client opens a document and immediately feels overwhelmed, you are not proving your worth—you are showcasing a massive lack of clarity.
To deliver high-impact seo client reporting that protects your monthly retainer, you must replace dense text documents with a dynamic, single-page dashboard built around three commercial pillars: business revenue conversions, organic traffic growth trends, and completed strategic tasks. By using a highly interactive tool like a custom looker studio seo report, you can synthesize complex technical tracking into a clean, scannable format that links organic rankings directly to a client's bottom line. This approach proves your clear value in less than sixty seconds.
At Memorable Design, we have transitioned our entire operations away from bloated deliverables to high-utility dashboards. This guide will reveal the exact frameworks, presentation structures, and data filters your digital business needs to transform retention metrics.
AI Overview
Traditional SEO reports like 50-page PDFs are outdated and ineffective because they overwhelm clients with technical data and hide real business impact. Modern SEO client reporting should focus on a simple, automated dashboard that highlights three key pillars: organic revenue/conversions, non-branded traffic growth, and completed SEO actions. Tools like Looker Studio help unify data into a clean, real-time view. Adding executive summaries and removing vanity metrics improves clarity, proves ROI faster, and increases client retention.
Why the Traditional 50-Page PDF Deliverable is Dead
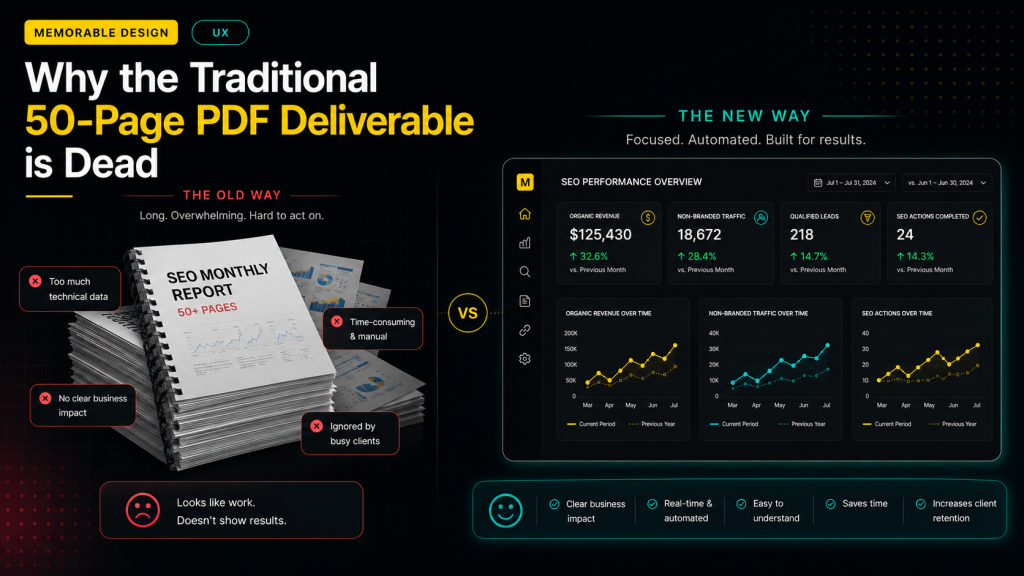
The legacy approach to digital agency metrics was built on an old-school corporate premise: the more pages you deliver, the harder it looks like you worked. However, modern business owners are busier than ever, and attention spans are at an all-time low.
The Problem with Extraneous Metric Dumping
When you include fifty different charts covering crawl errors, micro-rankings, and keyword density fluctuations, you are forcing the client to do the heavy lifting of figuring out if their investment is actually working. Most executives look at two things: how much money they spent and how many leads came through the door. Dumping raw database exports into their inbox signals that your team is hiding a lack of real commercial results behind a massive wall of confusing technical noise.
The Operational Burden on Your Team
Manually compiling massive, text-heavy monthly documents ruins your team's internal productivity. An account manager can easily spend up to four hours copying data, taking screenshots, and writing lengthy explanations for a single account. If you run a growing client reporting agency, spending dozens of non-billable hours on manual data entry every single month severely limits your ability to scale your service lines and focus on actual optimization tasks.
Building a Dashboard Around the Three Pillars of Truth
An elite reporting framework does not require endless commentary. Instead, it relies on a highly focused layout that connects technical performance directly to a business owner's primary financial drivers.
To achieve this, structure your layout so that the most important financial data sits right at the top. If a client can see their exact organic conversion growth within three seconds of opening a link, they will naturally trust your team to handle the deeper technical details below.
Step-by-Step Layout for a High-Retention Dashboard
Transitioning your portfolio to a modern data structure requires a radical shift in how you filter and present information.
1. Lead with the Conversions Dashboard
Start your master layout by highlighting hard business metrics. This section should display organic sales revenue, form submissions, phone call clicks, and qualified digital leads pulled directly from Google Analytics. Always compare the current month's performance against both the previous month and the previous year. Year-over-year comparisons are essential because they account for natural seasonal industry fluctuations that might otherwise look like a sudden drop in performance.
2. Isolate Non-Branded Search Visibility
The most common mistake in seo client reporting is blending branded search clicks with non-branded traffic. If a client's traffic spike is caused by a viral social media campaign that makes people search for their exact company name, your optimization efforts didn't drive that growth. Isolate non-branded terms inside your search console widgets to show exactly how many new customers discovered their website while searching for generic industry solutions.
3. Embed an Executive Summary Video
Instead of writing ten paragraphs of text that your client will inevitably skim, embed a brief two-minute video walkthrough directly into the top corner of your dashboard screen. Use a tool like Loom to walk through the dashboard page, highlight the biggest wins of the month, explain any temporary performance dips, and outline the upcoming content roadmap. This personal touch saves hours of meeting time and builds immense long-term relationship trust.
Choosing the Right Software Stack for Automation
To build a truly sustainable workflow, you need to step away from manual spreadsheets and embrace automated data pipelines.
The Power of Dynamic Cloud Dashboards
Building a standardized monthly seo report template inside a cloud-based visualization platform allows your data streams to refresh automatically every single day. This means your client can log in and view their live organic rankings whenever they want, which eliminates the frantic end-of-month scramble for your account management team. It positions your brand as a transparent, data-driven partner.
Harnessing Looker Studio for Clarity
For most growth agencies, leveraging a custom looker studio seo report is the most cost-effective and highly customizable solution on the market. It allows you to seamlessly blend data fields from Google Analytics, Search Console, and third-party tracking tools into a single cohesive interface. The clean design ecosystem perfectly aligns with the core philosophy at Memorable Design: stripping away unnecessary visual clutter to emphasize the essential strategic elements that drive business growth.
Metric Breakdown: High-Value vs. Low-Value Data
Not all digital data fields carry the same weight when presenting results to a non-technical stakeholder. Your layout must heavily prioritize impactful commercial trends over simple vanity metrics.
| Metric Type | What to Feature prominently | What to Filter Out or Remove |
| Financials | Completed checkouts, organic lead value | Average cost-per-click estimates |
| Traffic | Non-branded landing page organic clicks | Total raw page impressions |
| Keywords | Core commercial terms ranking on page one | Minor long-tail keyword jumps |
| Authority | Quality referring domain growth trends | Generic proprietary authority scores |
Based on available agency performance data, accounts that switch from a complex multi-page document to a hyper-focused conversion dashboard see a measurable increase in client retention rates. This happens because the business owner can clearly see the direct correlation between your retainer invoice and their incoming sales pipeline.
Scaling Your Client Communications Seamlessly
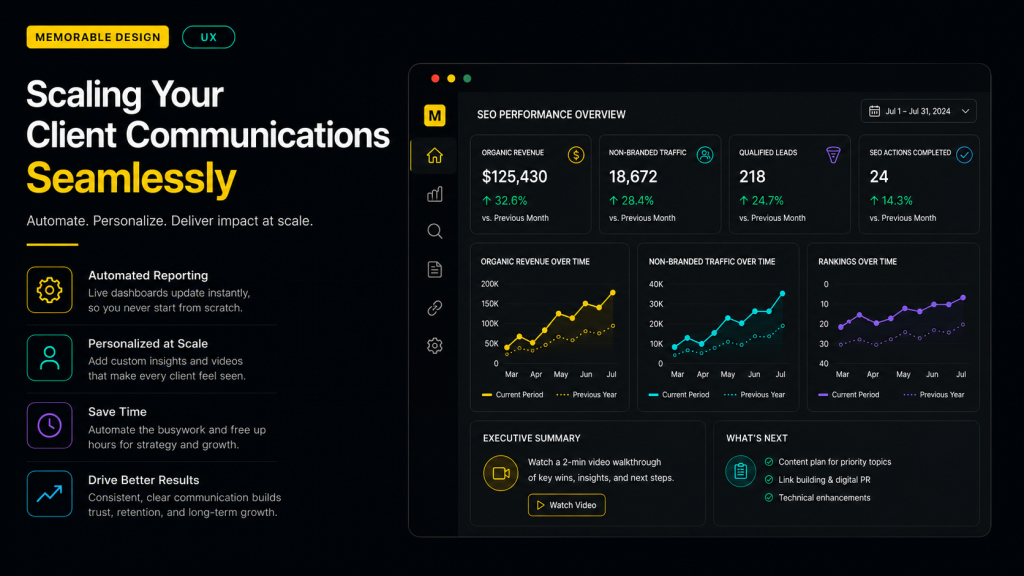
When running a busy client reporting agency, your communication style must remain highly professional, concise, and deeply grounded in reality.
Managing Expectations During Core Updates
Search algorithms are constantly changing, and search visibility will naturally fluctuate over time. Based on available market data, a website's organic traffic can experience estimated shifts of 15% to 20% following a major core system rollout. Use your automated dashboard to prepare clients for these cycles by showing long-term historical trend lines rather than hyper-focusing on isolated daily drops.
Streamlining the Monthly Review Call
Stop scheduling sixty-minute monthly reporting meetings just to read numbers out loud off a screen. Instead, email the dashboard link along with your embedded video summary 48 hours before your scheduled catch-up call. Frame the actual meeting as a forward-looking strategy session where you spend ten minutes reviewing past results and fifty minutes discussing high-level business expansions, upcoming product launches, and collaborative content ideas.
Conclusion
Proving the commercial impact of your organic optimization work does not require drowning your account partners in an endless ocean of technical data. True authority lies in your ability to simplify complex systems and highlight the precise commercial metrics that actually matter to an executive leadership team.
By ditching the traditional 50-page PDF and deploying a streamlined monthly seo report template built on a platform like Looker Studio, you save your internal team dozens of production hours while giving your clients a clear, transparent window into their business growth. Focus on conversions, eliminate vanity clutter, and use the clean visualization principles championed by Memorable Design to turn your seo client reporting workflow into a powerful asset for client retention.
Frequently Asked Questions
How often should clients check their live SEO dashboard?
While an automated looker studio seo report updates its data streams daily, you should actively discourage your clients from checking their metrics every single morning. Organic optimization is a long-term business play, and reviewing charts on a daily scale will only create unnecessary anxiety over minor, normal algorithmic fluctuations. Advise them to evaluate trends on a macro monthly or quarterly basis.
What should I do if a client insists on receiving a traditional PDF?
If an executive stakeholder explicitly requests a physical file for an upcoming board meeting, you do not need to rewrite your entire workflow. Simply export your single-page Looker Studio dashboard directly as a clean, high-resolution PDF file. This fulfills their administrative documentation requirement while maintaining your highly focused, conversion-first presentation format.
How do I report on SEO progress during the first 60 days?
During the initial phases of a new organic campaign, actual revenue conversions from search will naturally be low. Shift the primary focus of your seo client reporting layout toward early operational indicators of success. Highlight technical site health improvements, the removal of toxic crawl errors, initial impressions growth for core non-branded keywords, and the total volume of optimized content pages published by your team.
Should I include competitor data in my monthly reporting layouts?
Including a basic competitive tracking chart is an excellent way to provide broader industry context. Show a simple share-of-voice graph that compares your client’s primary organic visibility against their top three local or national business competitors. This reminds the client that optimization is an ongoing race, which makes it much easier to pitch future scope expansions and advanced keyword targeting strategies.


0 Comments