
Key Takeaways
-
Simplified organic tracking
-
Custom metrics for every team
-
Faster client reporting loops
-
Clear visualization of ROI
Introduction
Have you ever opened five different tabs just to figure out why your website traffic dropped yesterday?
It is exhausting, right?
We have all been there, staring at endless rows of raw numbers and wondering what actually matters.
That is where having solid seo dashboard examples comes in to save your sanity.
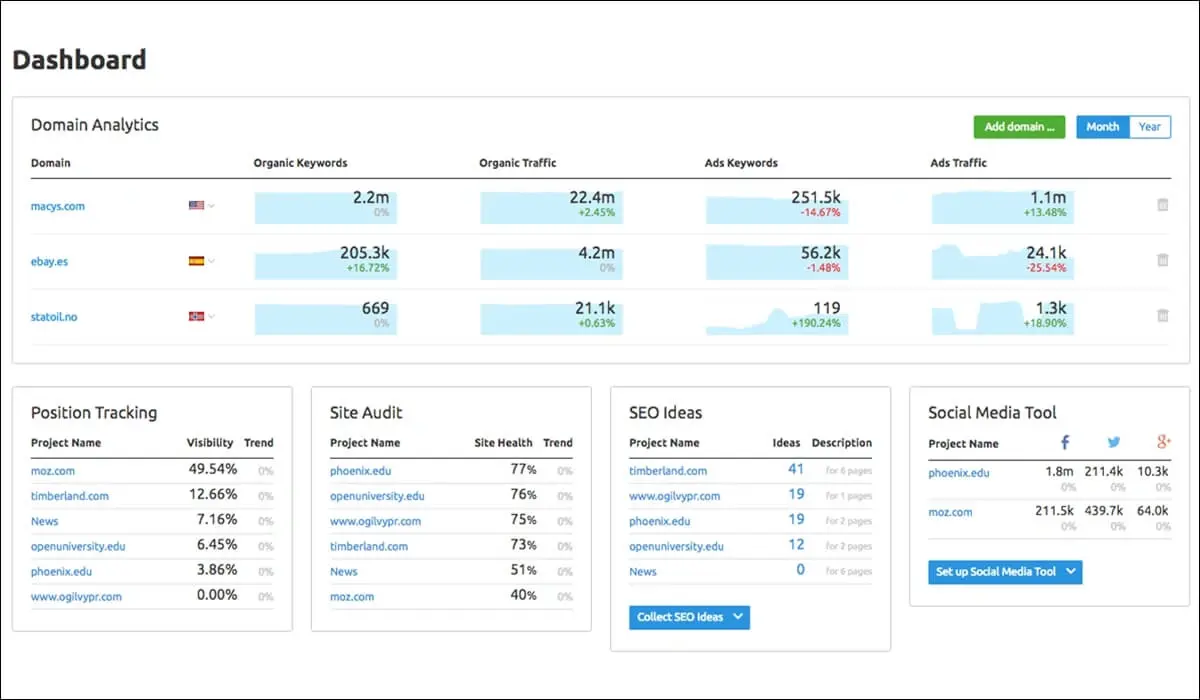
An SEO dashboard is simply a visual hub that pulls all your critical search data like rankings, organic traffic, and backlinks into one clean screen.
Instead of getting lost in spreadsheets, you get an immediate picture of your digital performance.
At MemorableDesign, we build reports that turn chaotic data into clear stories.
Let us walk through how you can simplify your tracking today.
AI Overview
An SEO dashboard combines essential website metrics like organic traffic, keyword rankings, bounce rates, and backlinks into a single visual report. By consolidating data from tools like Google Analytics and Search Console, these dashboards help marketers monitor performance, spot traffic drops, and present clean reports to stakeholders without digging through spreadsheets.
What Makes a Great SEO Dashboard?
Not all dashboards are created equal.
Some look fancy but tell you absolutely nothing useful.
A truly great dashboard focuses on clarity and fast decision-making.
It should answer your core performance questions within five seconds of opening it.
Here is how key reporting tools stack up when building your setup:
| Dashboard Type | Primary Focus | Best Used For | Setup Difficulty |
| Executive Overview | High-level ROI and traffic growth | C-Suite and Business Owners | Low |
| Technical SEO | Crawl errors and site speed | Web Developers & Tech SEOs | Medium |
| Content Performance | On-page engagement and keyword gains | Content Strategists | Low |
| Client Reporting | Goal tracking and monthly progress | Agencies & Freelancers | Medium |
When setting up reporting dashboards, you want to avoid clutter at all costs.
Focus only on the key performance indicators that drive real business growth.
If a metric does not help you make a decision, it does not belong on your main screen.
Top SEO Dashboard Examples for Every Goal
The Executive Summary Dashboard
Executives do not have time to analyze individual keyword fluctuations.
They want to know if organic search is driving revenue and leads.
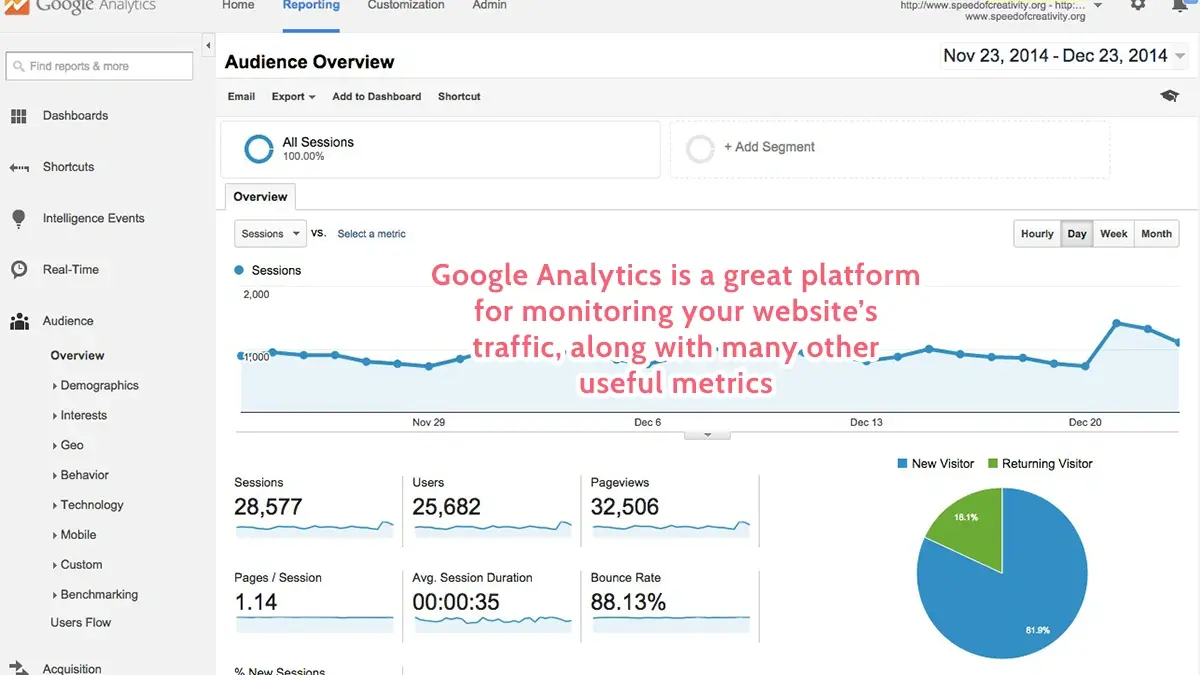
This type of dashboard highlights big-picture trends like overall traffic growth, conversion rates, and total revenue from search.
It keeps high-level stakeholders happy without getting bogged down in technical details.
The Technical Health Dashboard
If your site has broken links or slow load times, your rankings will suffer.
A technical health dashboard monitors server codes, indexation status, and Core Web Vitals.
It alerts you to critical site issues before they destroy your organic reach.
The E-commerce Tracking Dashboard
Online stores need to trace every sale back to its traffic source.
This layout connects organic rankings directly to product page views and shopping cart completions.
It gives e-commerce managers a clear view of which category pages yield the highest return.
Essential Metrics You Should Always Track
Building marketing dashboards can feel overwhelming if you try to track everything at once.
To keep things manageable, stick to metrics that directly reflect search performance and user behavior.
Here are the primary metrics to monitor closely:
-
Organic Sessions: The number of visits coming directly from unpaid search engine results.
-
Keyword Position Changes: How your target keywords are climbing or falling over time.
-
Organic Conversion Rate: The percentage of search visitors who complete a desired action.
-
Top Landing Pages: Which specific pages attract the most search engine traffic.
-
Backlink Growth: The total volume and quality of new referring domains pointing to your site.
Tracking these core elements ensures your team stays focused on meaningful growth rather than vanity numbers.
How to Build Your Own Dashboard Step-by-Step
Choose Your Core Data Sources
First, connect your essential analytics accounts.
Google Analytics 4 and Google Search Console are non-negotiable foundations for any search report.
You can also integrate third-party tools for deeper backlink and competitor tracking.
Group Your Data Logically
Organize your metrics into clear visually distinct zones.
Put high-level performance cards at the top of your layout.
Follow up with detailed charts and trend lines directly underneath.
Automate Your Updates
Never waste hours manually copy-pasting numbers into slides every Friday.
Modern reporting dashboards update automatically in real time or on scheduled daily syncs.
At MemorableDesign, automated workflows keep our team focused on strategy rather than repetitive data entry.
Comparing Popular Dashboard Platforms
Choosing the right software depends on your team size and budget.
Here is how the top reporting platforms compare:
| Platform | Strengths | Weaknesses | Ideal User |
| Google Looker Studio | Free, deeply integrated with Google apps | Can be slow with large datasets | Beginners and small teams |
| Semrush | Excellent competitor and keyword data | Higher monthly subscription cost | Professional SEO agencies |
| Ahrefs | Industry-leading backlink analysis | Limited custom visual layouts | Technical SEO specialists |
| Databox | Mobile-friendly, easy goal tracking | Free tier has strict limits | Mid-sized marketing teams |
Evaluating these choices helps ensure you do not overpay for features you will never touch.
Common Dashboard Mistakes to Avoid
Packing Too Much Information on One Page
When everything is highlighted, nothing stands out.
Resist the urge to include every single chart your software offers.
Keep your views focused on specific team goals.
Ignoring Context and Trends
A static number rarely tells the full story.
Always compare current numbers against previous months or yearly periods.
Showing trend lines helps explain whether a traffic shift is normal seasonal variation or a real problem.
Forgetting Mobile Responsiveness
Many clients check their updates directly from their phones during quick breaks.
Ensure your visual cards stack cleanly on smaller screens.
If a chart gets squished on mobile devices, switch to a simpler table layout.
Tailoring Reports for Clients vs. Internal Teams
Internal teams need detailed granular data to fix specific issues.
They want to see toxic backlinks, thin content warnings, and individual keyword rank drops.
Clients, on the other hand, care about overall business progress and clear returns on investment.
When crafting external marketing dashboards, prioritize simplicity and actionable insights.
Add short summary callouts explaining what the numbers actually mean for their business bottom line.
This builds deep trust and saves everyone from long, confusing review meetings.
Working with clean seo dashboard examples allows your business to communicate performance clearly across every department.
Whether you manage one site or dozens, streamlined reporting keeps your entire digital strategy on track.
Conclusion
Tracking search performance does not have to feel like deciphering secret code.
By looking at proven seo dashboard examples, you can design a layout that saves time and reveals real growth opportunities.
Focus on clear metrics, automate your data collection, and match your presentation style to your audience.
With the right setup, you will spend less time building reports and far more time scaling your traffic.
Frequently Asked Questions
What is an SEO dashboard used for?
It centralizes key website metrics like rankings, organic traffic, and backlinks into one easy-to-read report.
Which free tool is best for creating SEO dashboards?
Google Looker Studio is generally considered the best free tool because it connects directly with Search Console.
How often should I check my SEO metrics?
In most cases, reviewing weekly trends works best, while monthly deep dives help guide long-term strategy shifts.
What are the most important metrics on a client dashboard?
Organic traffic volume, keyword conversions, total leads, and top-performing pages are estimated to matter most to clients.